The responsibility of developers towards their apps doesn’t stop at deployment. Assessing an app’s success after its release is just as important as any other stage of the development process and helps in evaluating its success.
Just over 12 years ago, Apple’s App Store launched with 500 apps. We dove into the era of mobile technologies, and ever since, the world has been spiraling towards an app-centered life. Whether this is a good thing or not is up for debate, but what we can’t argue with is that apps have revolutionized how humans function. Thanks to apps, we have access to everything with just a swipe of our fingers, which explains why they have taken over the world by storm almost 12 years later.
As a result of this growth, there are currently nearly 9 million different apps available, with an average of 30,000 released monthly through Apple’s App Store and 80.000 through Google’s Play Store. These numbers fluctuate each month, but they testify how pervasive mobile apps are in our lives. To further drive this point home, so far this year, users have spent $32 billion on apps in both Apple and Google stores, with Apple leading the way in downloads.
But what’s behind app adoption? What goes on behind the curtains of those little bits of technology that give us access to the world’s entire musical spectrum or meet romantic partners? What makes them good, durable, and usable? Wholesome development processes. You see, app development doesn’t stop at deployment. Competent development teams know that developing and deploying is just the tip of the iceberg. Delivering a successful app is a long journey that requires ongoing commitment and support so that apps stand the test of time. One crucial step of this journey is measuring app performance. This process comes after your app is out, and you have information that helps you track its key performance indicators (KPIs). Determining your app’s KPIs is crucial to optimize it and improve your user experience.
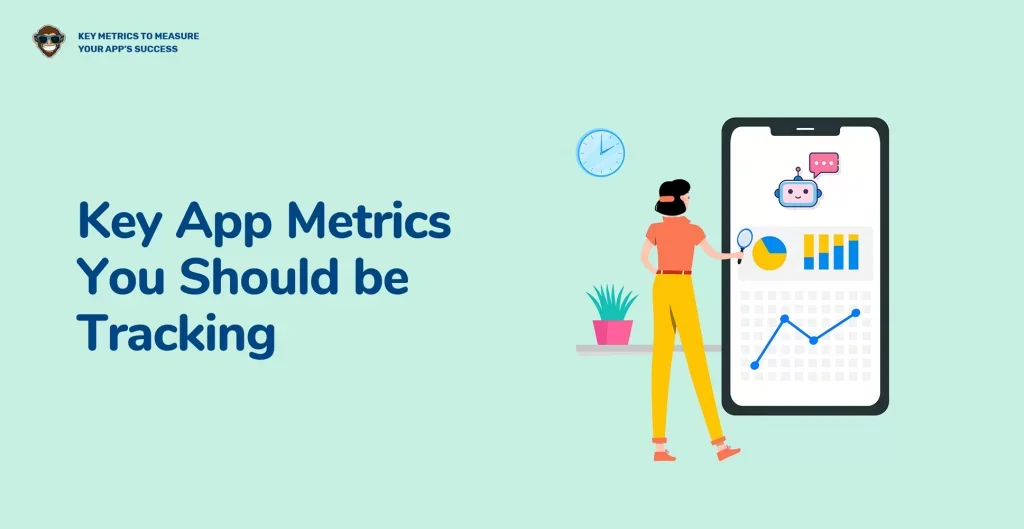
Key App Metrics You Should be Tracking
There are countless mobile app metrics and trackable criteria that are useful to measure your app’s success. However, selecting which KPIs you should measure involves defining what good performance means for your app. Also, it depends on the data you have available and how to read and measure it.
This article will explore some of the critical app metrics that we use at Foonkie Monkey to keep all our deployed apps in check and performing smoothly. These are the ones that we consider to be the most relevant. Still, which app metrics you choose to employ depends on your app, its limits, and your goals. You can use all of them, most of them, just a few, and even other more specific ones that we may not have included here.
We’ve broken them down into four categories:
- Performance metrics: These metrics focus on how your app is functioning.
- Engagement metrics: These metrics highlight how users interact with the app and if they’re engaging with it.
- User Acquisition metrics: These focus on where your users come from. They also measure if users stick to the app and whether your app is meeting their expectations.
- Revenue metrics: These determine the revenue generation or profitability of your app.
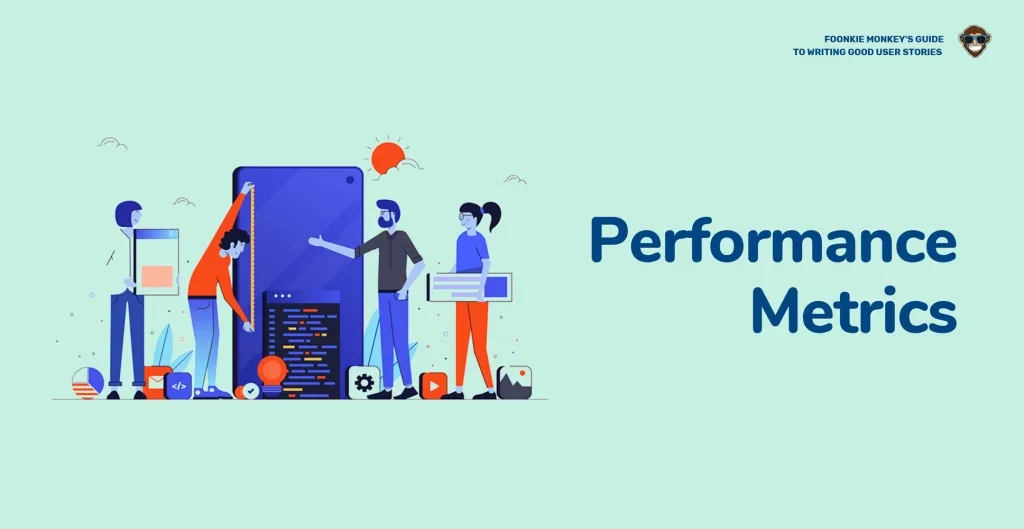
Performance App Metrics
• Number of crashes
Fact: users have a very low tolerance for app crashes. Don’t believe us? Research shows that only 16% of users will try a crashing app more than twice before uninstalling it. Albeit conducted some years ago, this study highlights the importance of using this metric. Gathering and measuring your app’s number of crashes gives you a look at how often your app closes abruptly while in use. Crash reports also show you at what point the app crashed and what caused the crash. Crash reports are crucial for pinpointing and fixing performance issues, operating system incompatibilities, device incompatibilities, or any other bug that may be causing the crash.
It’s crucial you gather and adequately analyze data from this metric to keep your app crashes to a minimum. Also, you should continually test during all development stages to identify issues right away and fix them on-the-go instead of risking glitches once your app is live. It’s also crucial you have a relevant QA testing strategy, do beta-testing, and have constant updates and maintenance measures in place after your app goes live. You can use tools such as Crashlytics, Instabug, or the diagnostics and reports provided to you by the app stores.
• Latency
Not to be confused with speed, app latency measures the time it takes your app to make a request and receive a response from an API. You must monitor this duration closely because you need to make sure it is as brief as possible. We’ll dig into speed soon, but you must differentiate it from latency.
Latency mainly affects the responsiveness of your app and how long it takes for it to receive a response after your user acts. In other words, this metric lets you quantify the time it takes between, let’s say, a user pressing a button, your app making a call to the API server, interpret the information, return the response for the request, and finally display the requested information. An ideal latency time is between 1 and 3 seconds. However, it really depends on how many APIs your app uses and how good you are at maintaining them at optimal performance levels.
It’s important to note that latency must be treated as a feature; hence, you should dedicate time to making sure it works, especially across multiple versions of an operating system. This metric is closely linked to API maintenance, so be sure to follow good API and latency monitoring practices.
• Load Per Period
Like latency but not quite the same, your app’s load per period deals with response times but from a different perspective. App load per period measures how your app responds to many requests in a short period. Monitoring this metric is crucial to avoid users overloading the app with too much input. Load per period metrics are also important because sometimes users are impatient or have slow connections, leading to scenarios such as getting impatient and tapping something repeatedly to get it to load. You can easily keep an eye on your app’s load per period metric through proper manual QA testing or automated QA testing tools.
• Speed
There’s a reason why smartphone manufacturers are always coming up with faster processors for their devices: users love speed. A survey conducted by Akami shows that 30% of surveyed app users will wait 6-10 seconds for a page to load, and only 15% will wait for longer than 20 seconds before abandonment. For your app, speed metrics generally determine how fast your app loads and runs. For every extra second your app takes to load or run pages, you risk losing valuable engagement from your users. Hence, you can’t ignore speed, and we suggest you always treat it as a feature, which implies you need to dedicate time to optimize, monitor, and find ways to improve your app’s speed.
Luckily, you can quickly gather data on your app’s speed metric and analyze it. You can monitor how fast your app works by getting feedback from QA analysts and testers over frequent iterations. You can also use performance monitoring tools such as New Relic, AppDynamics, or Rollbar. These tools can let your team know exactly when your app has speed issues, and they offer complete diagnostic reports and other analytic resources to help you keep your app running at optimal speeds.

Engagement App Metrics
• Number of Downloads and Installs
The number of downloads your app has on app stores is the first indicator of whether your app is successful or not and gaining the recognition you aimed for. It’s paramount that you keep in mind that the figures coming from download and installation metrics should theoretically be the same. If users download the app, they should ideally be able to install it without a hitch. However, if you note a difference between these two app metrics, it probably means the app has an issue with the installation process that needs to be addressed ASAP.
On the other hand, if your app is working smoothly, but you see few or no downloads, that’s your queue to start looking for problems in your marketing and ad strategies. Furthermore, keeping an eye on this metric will give you valuable insight into how your app trends over time and if your marketing, maintenance, and word of mouth are going well. Still, if you notice that your app isn’t getting the downloads you want, consider revisiting your app’s branding efforts or look into optimizing your app’s listing in app stores. Remember: your app’s visual aspects, such as name and icon, are what users first see, and they can determine whether or not they end up downloading your app.
• Session Interval and Session Length
This metric determines how frequently your users return to your app and how much time they spend on it, from when they open the app to when they close it or remain inactive for some time. This metric will help you gauge how long your users take to open your app again after they close it.
As a rule of thumb, short session intervals are better because that means your users are regularly engaging with your app. However, an optimal session interval metric depends on your app’s purpose and your users’ needs. Some apps don’t require short session intervals to engage users, but others do. Hotel booking apps, for instance, have longer session lengths but shorter session intervals. Users spend more time finding a hotel but probably won’t open the app again for a while once they book it.
On the other hand, your session length metric determines how long users spend on the app per individual session. Like your interval metric, your session length metric also depends on your app. Keep in mind though, that on average, users worldwide spend 3.5 hours per day in apps. So, to capitalize on that number and get your app a good chunk of those 3.5 hours, you must optimize your flows and functionalities to make sure your users spend an appropriate amount of time using your app.
In this metric, more is not necessarily better. For instance, an e-commerce app aims for long session lengths because users should take a while browsing and choosing items before performing the checkout process. On the contrary, an e-wallet app may have short session lengths but long session intervals because e-wallets are fast and efficient. So make sure you determine what a reasonable session interval and length means for your app and optimize for it.
• Active Users
This metric is crucial for measuring your app’s success in that it measures the number of users that are using your app, not only downloading it. Sometimes, your users might download your app but not use it regularly or at all, which is counterproductive for your engagement purposes. Herein lies the importance of remembering that your active users metric is different from your downloads metric. Active engagement is crucial to measure your app’s success, and it also helps you segment your active users depending on the frequency of their sessions. You can split your active users into two: daily active users (DAU) and monthly active users (MAU).
DAUs are those users that have at least one session a day, whereas MAUs are users that have at least one session per month. MAUs appear to be synonyms for failure, right? One session per month sounds incredibly low, but again, these app metrics aren’t one-size-fits-all, and they depend on your app. Still, both of these metrics are extremely useful to measure your app’s success in different ways. DAU, for instance, is useful for determining the exact number of users that stick with your app and use it every day. You can also divide your DAU and MAU to determine your app’s stickiness:
- DAU / MAU = Stickiness
Your app’s stickiness determines if users are coming back to it, and it is closely related to its engagement and hence, to its success. It gives you a glimpse into how many of your MAUs are turning into DAUs. If you consider that, on average, an app loses 77% of its DAUs within the first three days after install, you can understand the importance of keeping an eye on this metric.
• Retention Rate
Retention rates are paramount to understanding the success of your app because they measure the number of users that return to your app after the first use. If your users keep returning to your app, it means the app has real value to them. And since your app’s success greatly depends on your users sticking with it (hopefully forever), the retention rate is one of the most valuable and insightful metrics.
Retention app metrics typically deliver a percentage of those users who keep returning to your app, thus highlighting your most engaged and valuable users. This percentage will undoubtedly help you provide a better user experience. It can also help you to better focus your marketing endeavors by giving insights on in-app purchases, purchase frequency, and location, among others. Additionally, studies have found that the average person has 40 apps on their phone, but they spend 89% of the time split between only 18 of those apps. So, these numbers highlight the importance of retention metrics to avoid your app falling into the void of those 22 unused apps.
If your retention numbers are low, you need to diagnose why your users aren’t returning to your app. You can track your app’s retention rate by measuring it over a daily, weekly, and monthly period. Doing this can help point you in the direction of where or when you’re losing users and attribute said losses to specific updates, marketing campaigns, technical issues, or other possible causes.
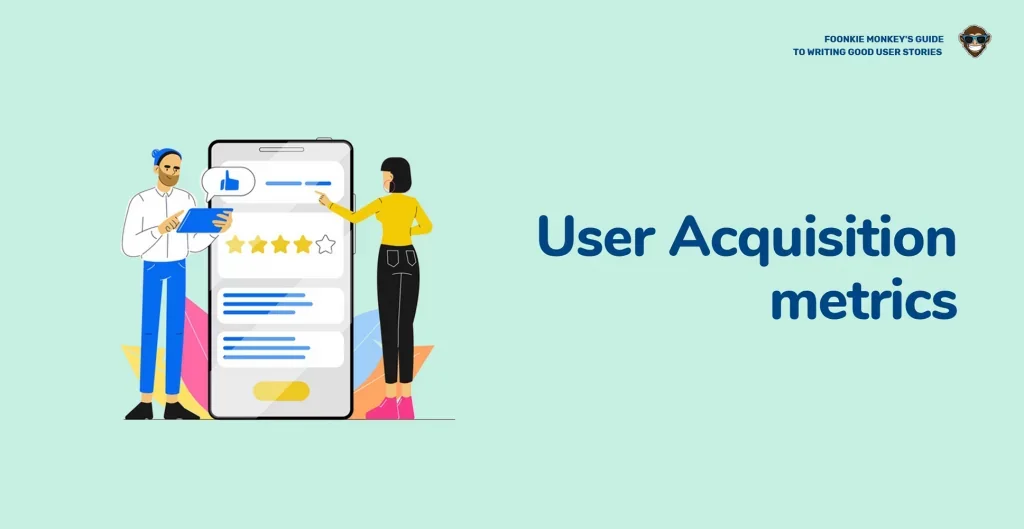
User Acquisition Metrics
• App Rating and Reviews
Researching your app’s rating is the fastest way to see what your users think of it and measure their satisfaction level. It also helps your users see how others perceive your app and what they think of it, ultimately encouraging or discouraging new users from downloading your app. It’s no secret that most of us do research before consuming any good or service, so this metric is fundamental to understand how your app is doing out in the world and guide your users in the right direction.
Additionally, your app’s rating can also affect its ranking in app stores, affecting its visibility and determining download and install rates. If you’re not sure about the relevance of your app’s ratings and reviews, consider the fact that studies have shown that 91% of adults blindly trust online reviews, and 93% of surveyed consumers make their purchase decisions influenced by reviews.
If your app’s rating isn’t where you want it to be, try researching common complaints and gathering feedback to address potential problems or reasons for your low ratings. After providing updates and fixing your app’s issues, try prompting your users to rate your app, but only after you’ve proven your app is worthy of a five-star rating. Also, you can try to engage directly with disappointed users and ask them to point any issues or reasons for their low ratings and poor reviews. This way, you’re going right to the source.
• Funnel Tracking
Where are you losing more users? Is your onboarding process effective? A funnel analysis can help you answer these questions and guide your understanding of how users engage and interact with your app. It enables you to track your users’ journeys through a model that lays out how many steps they have to take to reach your conversion point.
This method also provides insight into how many users are dropping off before converting and at what stage. It also helps you visualize your user journey and gives you an idea of how many people stick with your app and how many drop off. Establishing what conversion means for your app is crucial for proper funnel tracking because this is what determines the funnel’s climax. What determines your app’s conversion? Is it selling a subscription? A sign-up? An in-app purchase? A referral?
Once you’ve established the most crucial stage of the funnel, you need to create your flow of conversion events that will lead to that final stage. For instance:
- Click Ad
- View app store page
- Download
- Get a free trial
- Sign up
- Purchase subscription (Final step)
This way, funnel tracking will help you track how many users are reaching the conversion stage, how many are dropping off, and at exactly which stage they are dropping off. For instance, if you have 100% of your users reaching the “Get a free trial” stage but you get only a 20% to the “Sign up” stage, it means your free trial isn’t fulfilling their expectations. When you notice users dropping off at a particular stage, focus on that stage and identify the problems that stop your users from reaching conversion.

Revenue Metrics
• Average revenue per user (ARPU)
As you already know, there are various forms of monetization in apps. There are paid downloads, subscriptions, ad clicks, and in-app purchases, to name a few. Whichever source of income, you need to track your app’s success by measuring how much revenue your app is bringing in per user. This metric is your app’s ARPU, and not only is it a critical metric for investors, but it is also a key indicator of whether you will meet your revenue targets. This metric also allows you to steer your marketing campaign in the right direction by showing you what your users like to spend their money on and how solvent they are. On this point, It’s important to note that usually, users of different operating systems and devices have different spending behaviors.
You calculate your app’s ARPU by dividing your total revenue by your total number of users.
• Cost per Acquisition (CPA)
Your CPA metric helps you measure how much money you have to spend to get an active, paying user. CPA is a crucial metric to understand your app’s marketing and financial success. However, there is no universal standard that defines an optimal CPA, so, as with most other metrics, you must determine your margins, revenue thresholds, limits, and operating expenses. Establishing these factors firsthand will enable you to calculate better how much you can afford to pay for acquiring users. Keep in mind that acquisition costs include ad and PR expenses, technology costs, hosting and infrastructure costs, salaries, contract fees, development expenses, and even legal help, to name a few.
You can calculate your CPA by dividing the total costs incurred to complete a process (it can be the total spent or the amount paid in a specific campaign to acquire users) by the total number of user acquisitions.

Concluding Note
Measuring your app’s success is the coup de grace that will culminate the effort and time you spent ideating, developing, and delivering your product. Establishing an effective KPI tracking methodology and sticking to it will give you a dependable base for keeping your app live for a long time. It will also drive your app optimization and maintenance processes to keep your app updated and ensure your client base keeps growing, even well after deployment.
All the metrics exposed in this article and those that didn’t make it but are just as valuable can give you an honest, accurate picture of how your customers interact with your app. That picture is an invaluable step forward in delivering value to their lives and giving them usable tools to keep them engaging with your app.
Whether you’re a developer and have further questions on metrics, or you’re looking into developing your app, please, don’t think twice about contacting us; we’re here to help!